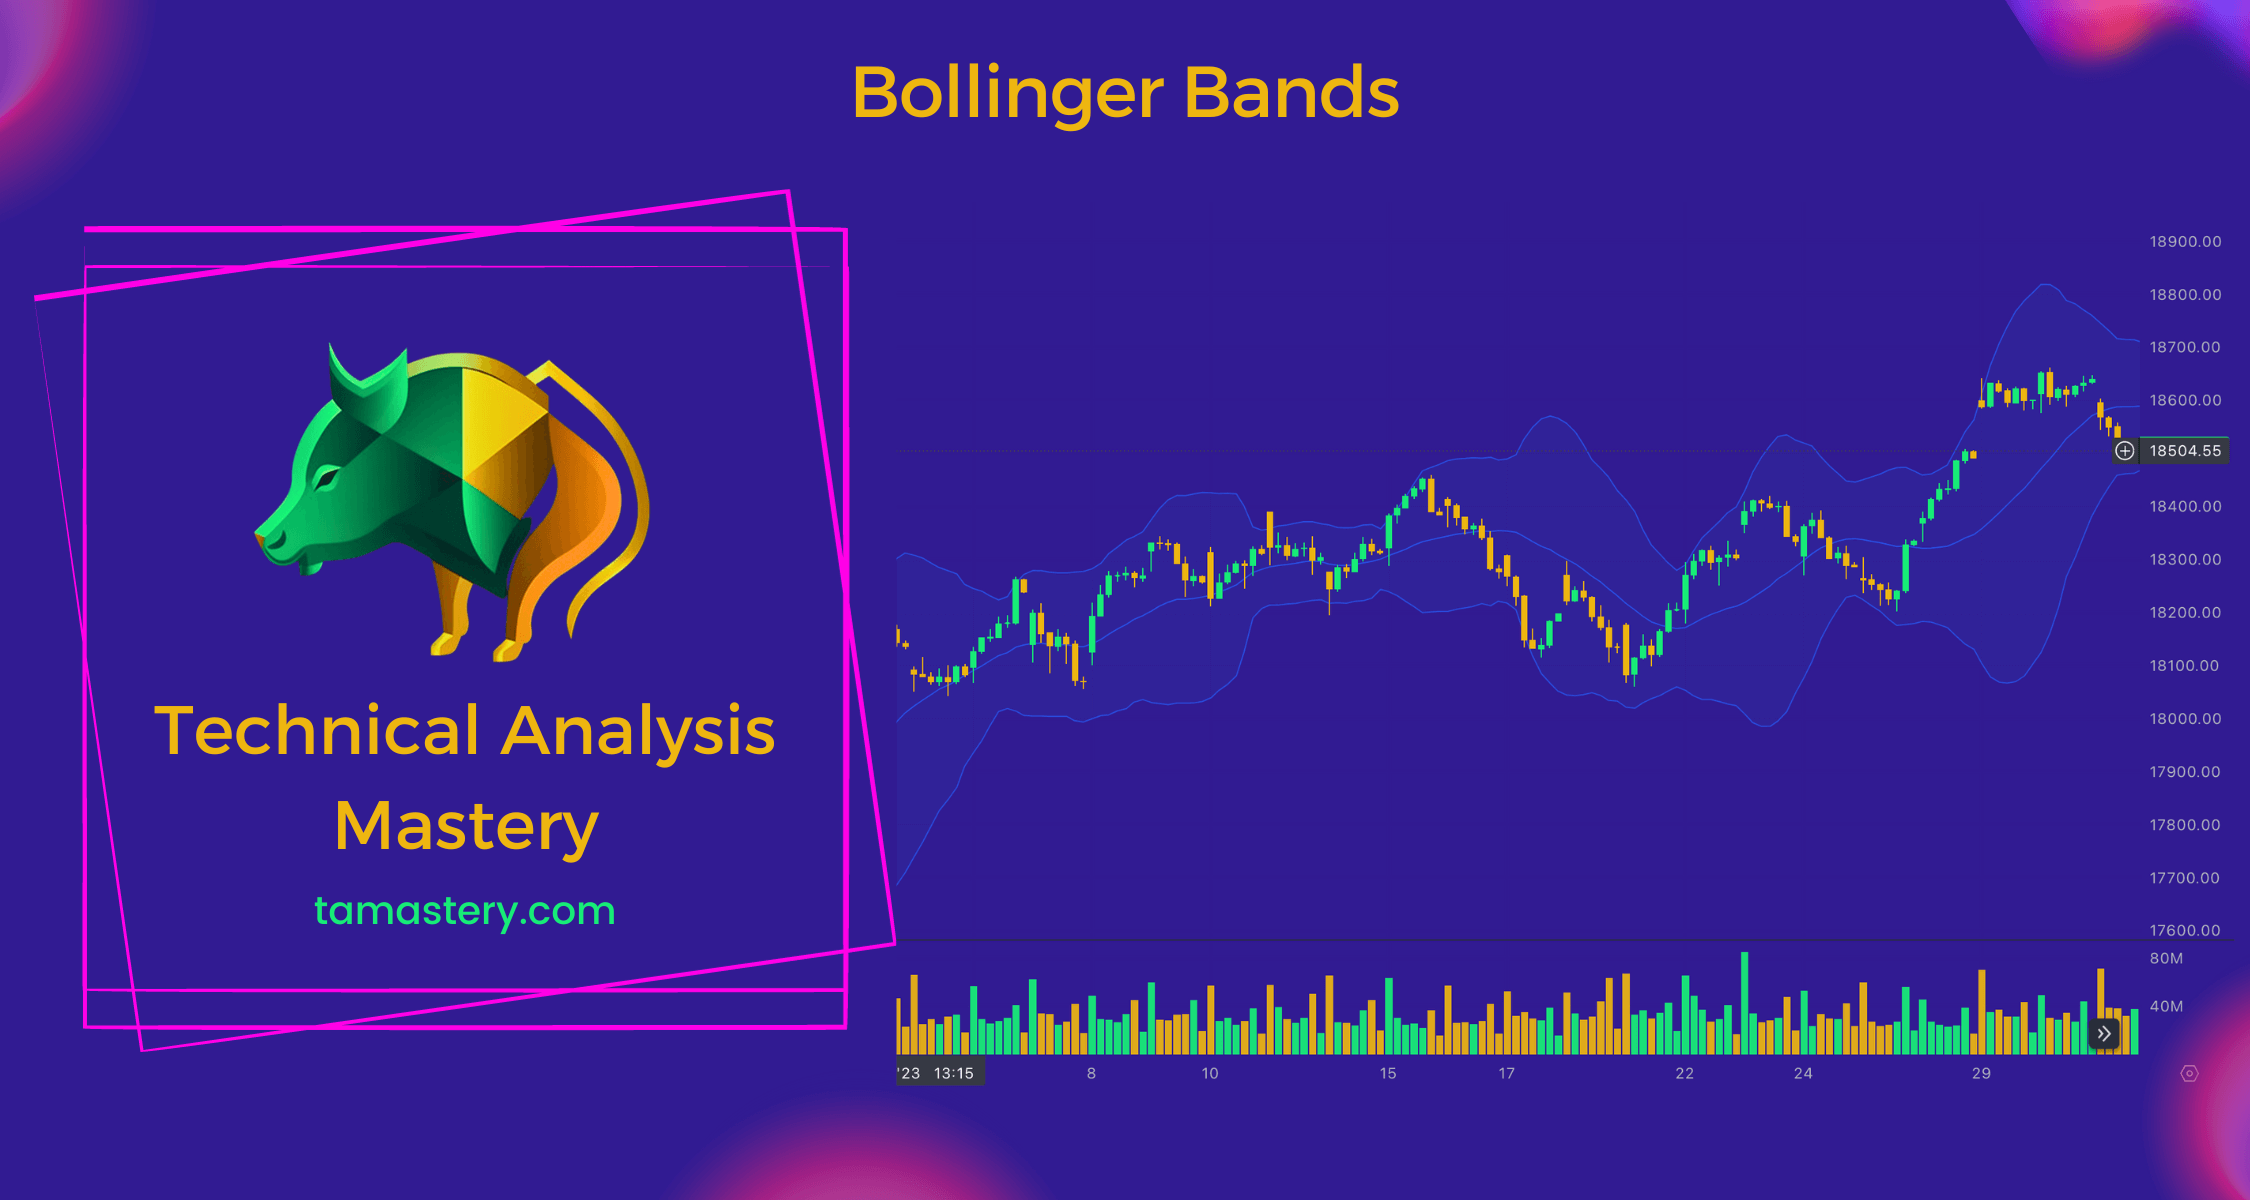
Bollinger Bands Bollinger Bands: A Fun Roller Coaster Ride in Stock Trading Dive into the thrilling world of stock trading with Bollinger Bands. Understand how these 'roller coaster tracks' guide traders through potential highs and lows of a stock's price, empowering you to make more informed decisions.
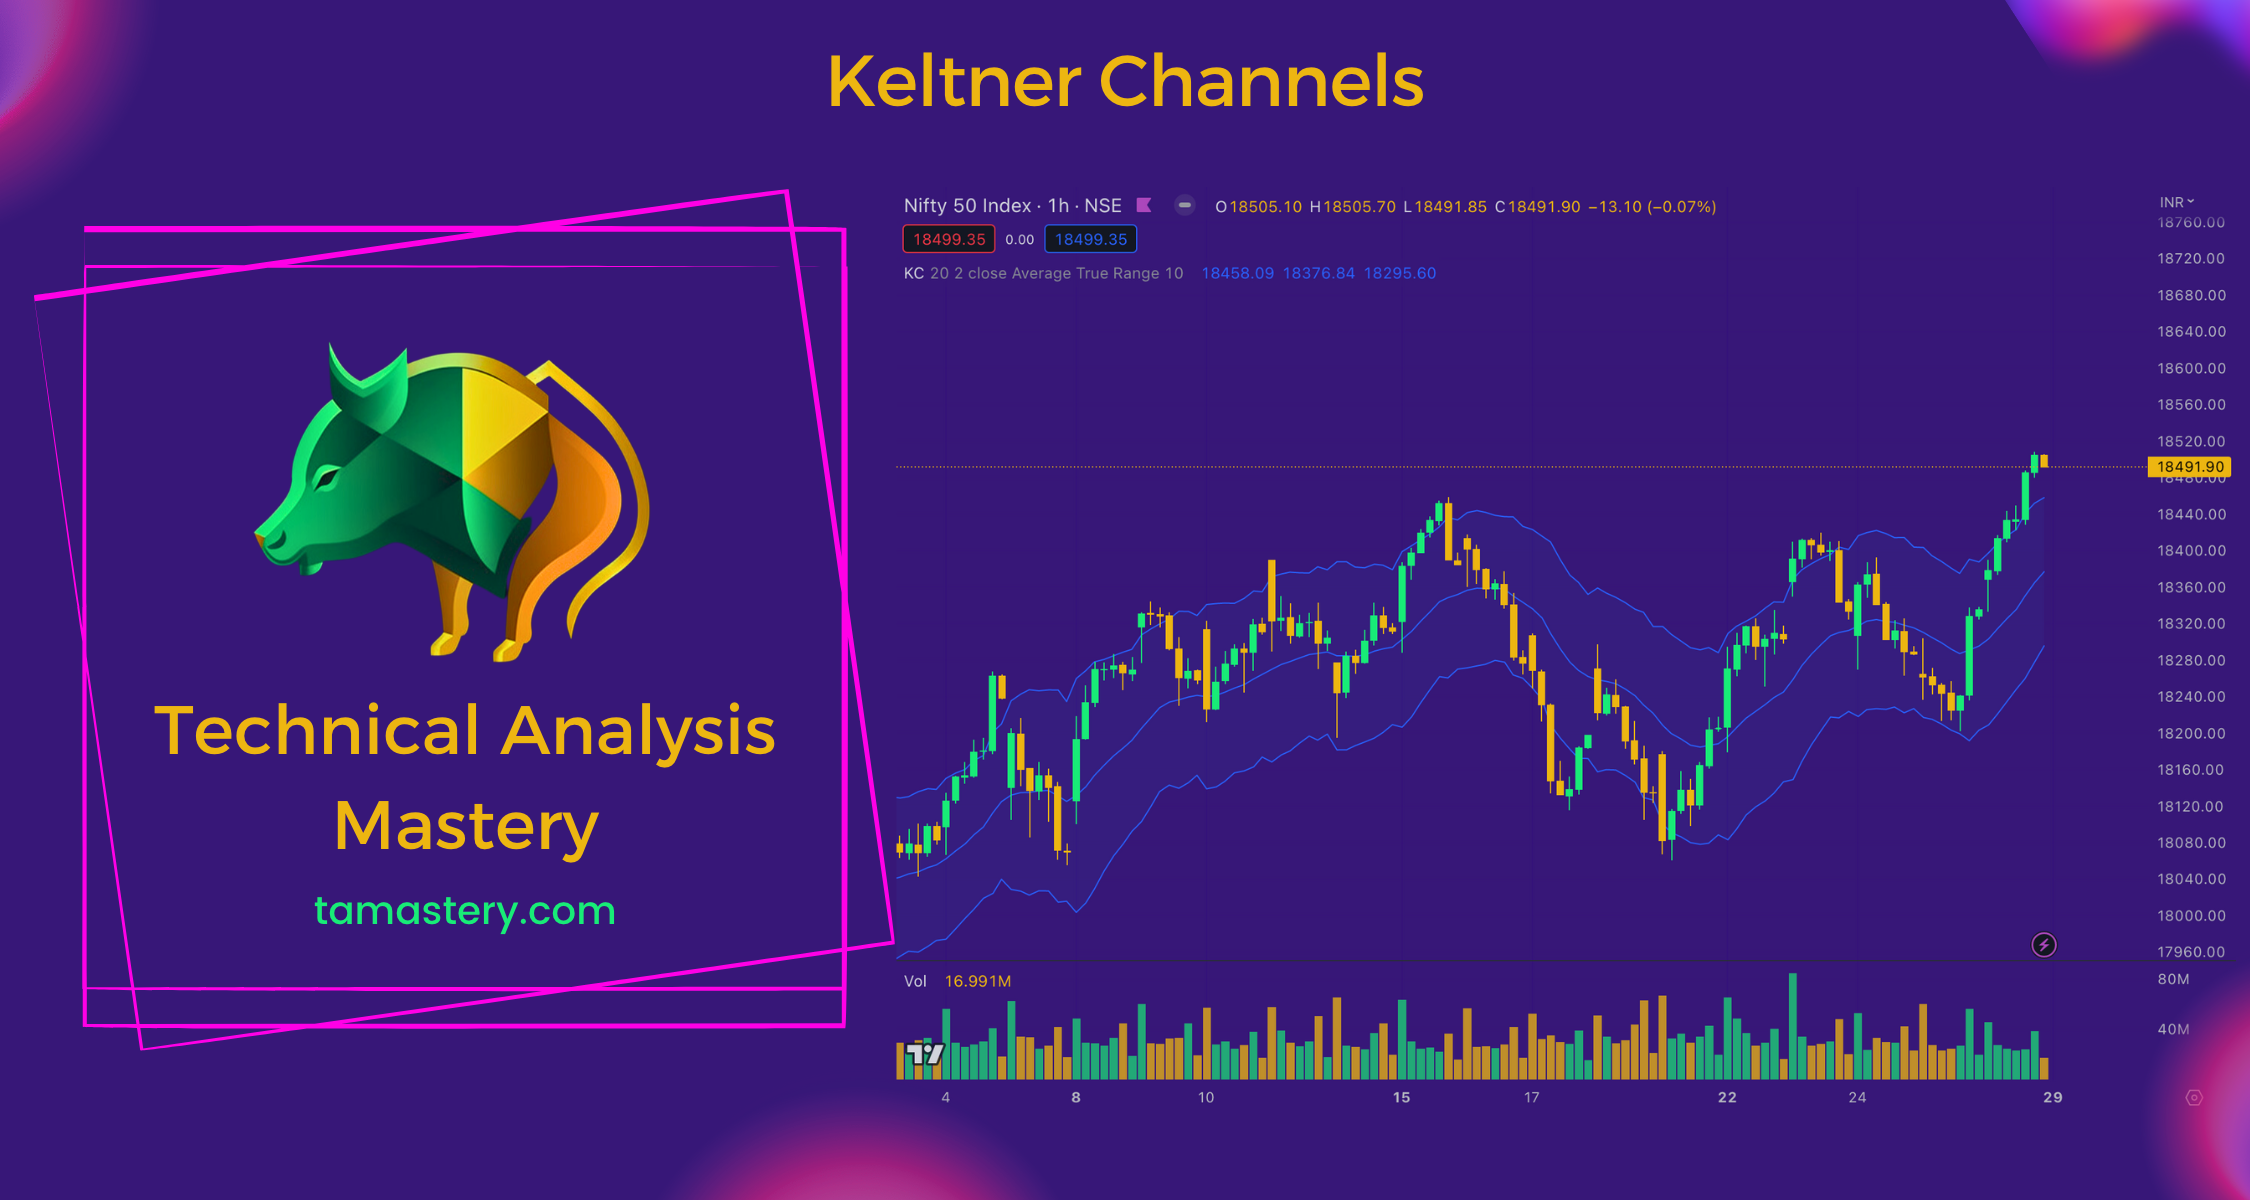
Keltner Channels Keltner Channels: The Race Track of Stock Trading Explore Keltner Channels, the race track of stock trading. This tool charts the typical path of a stock's price, helping traders predict potential shifts. Just like racetrack guardrails, Keltner Channels signal when it may be time to buy or sell. Enhance your trading strategy with this dynamic tool.
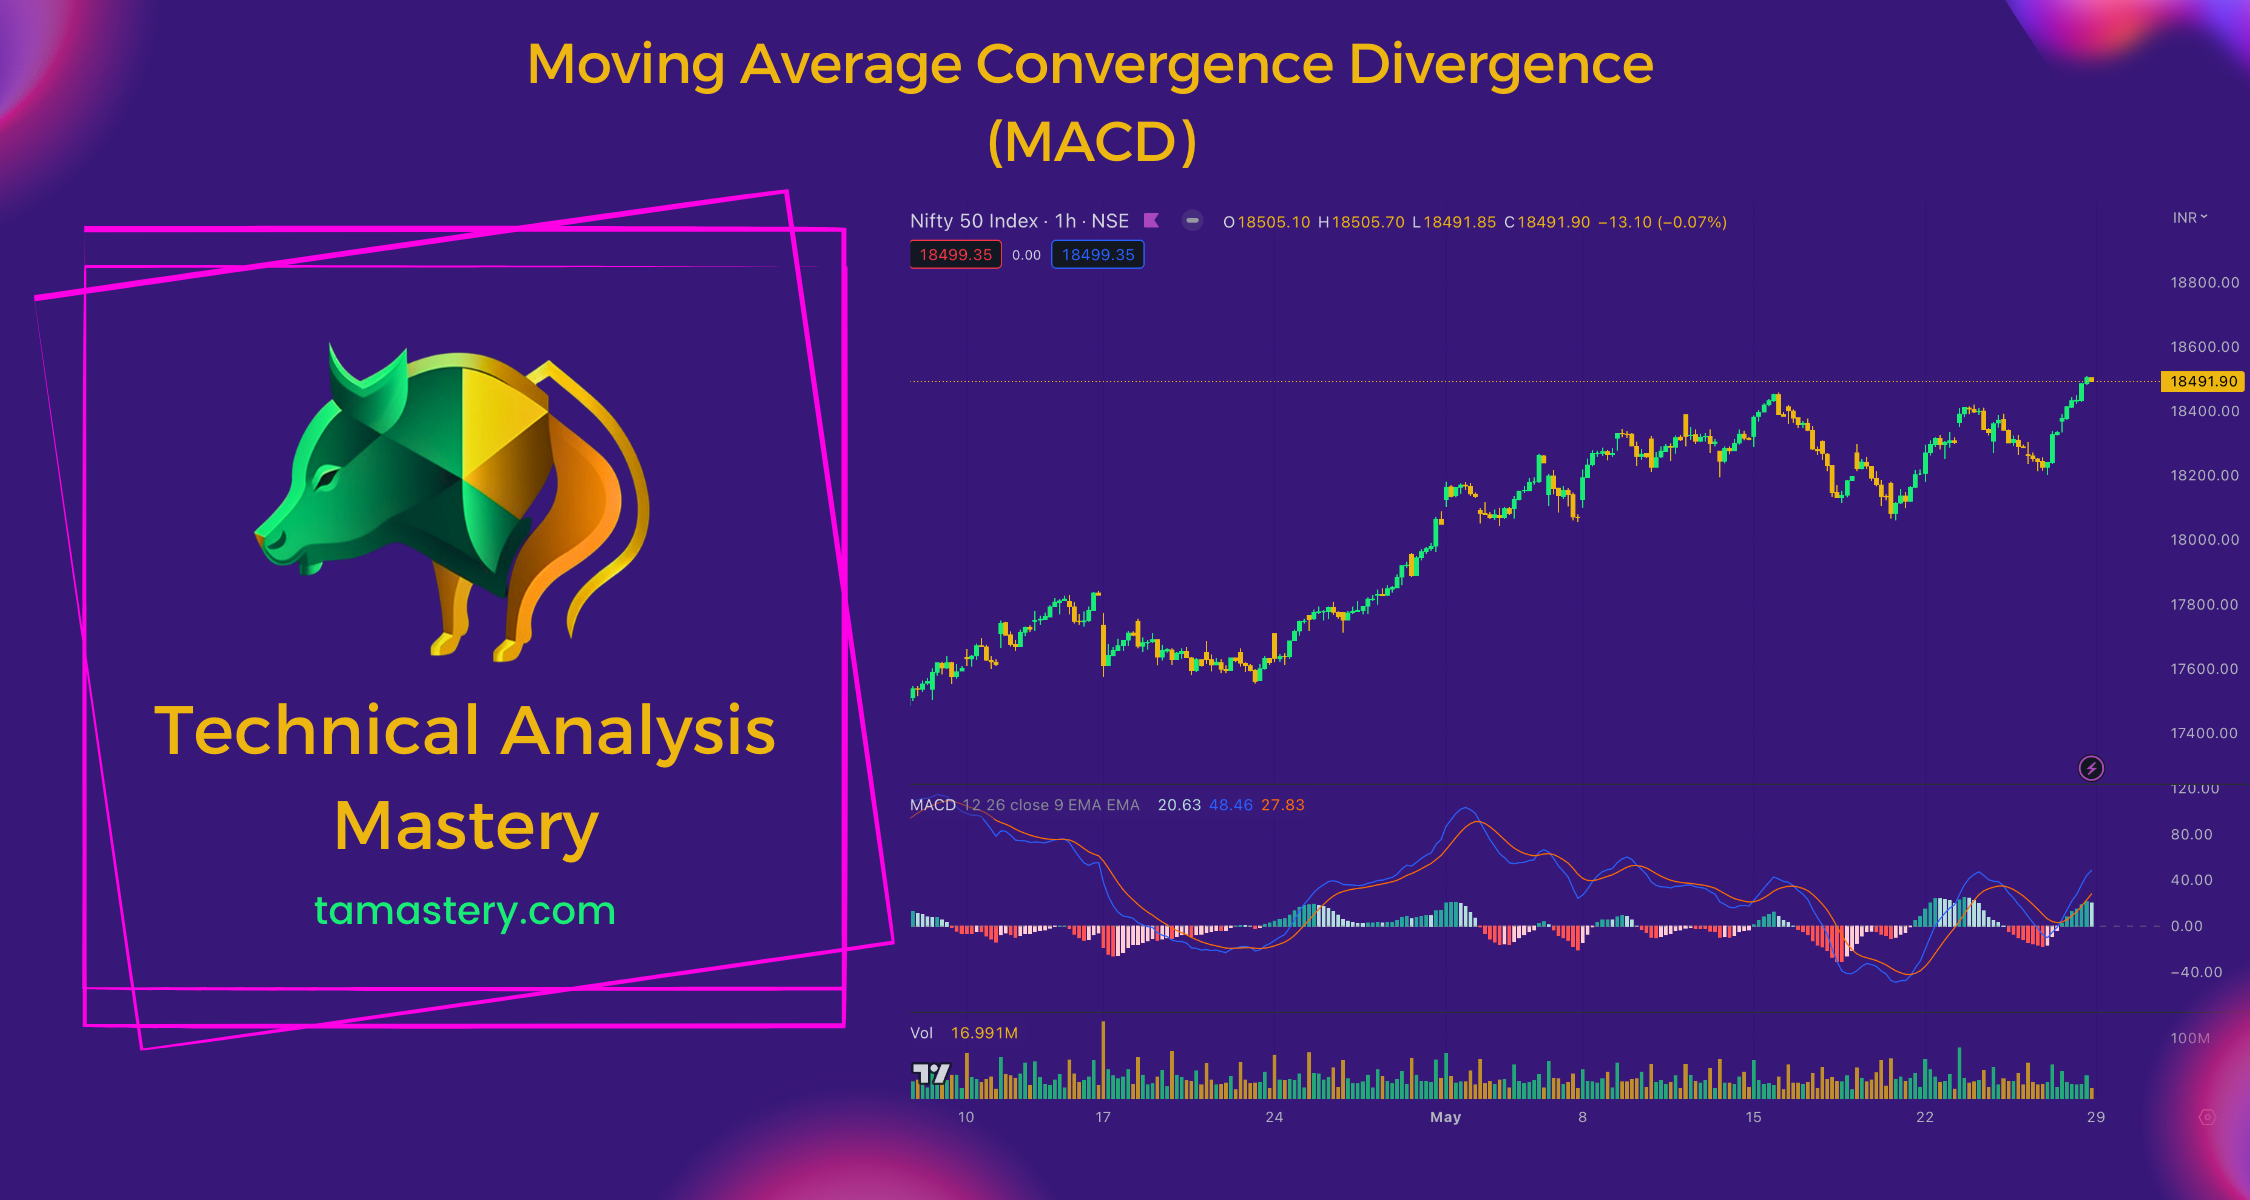
MACD The MACD: Uncovering the Secret Signal of Stock Trading Learn about the MACD, or Moving Average Convergence Divergence, a technical trading tool acting like a secret signal predicting possible stock price changes. This comprehensive guide simplifies the MACD concept, making it accessible for beginner traders.
Exponential Moving Average Unpacking the Exponential Moving Average: A Smoother Trail for Stock Trading Dive into the Exponential Moving Average (EMA) in stock trading. Learn its difference from the Simple Moving Average (SMA) and how EMA's focus on recent price changes guides trading decisions.
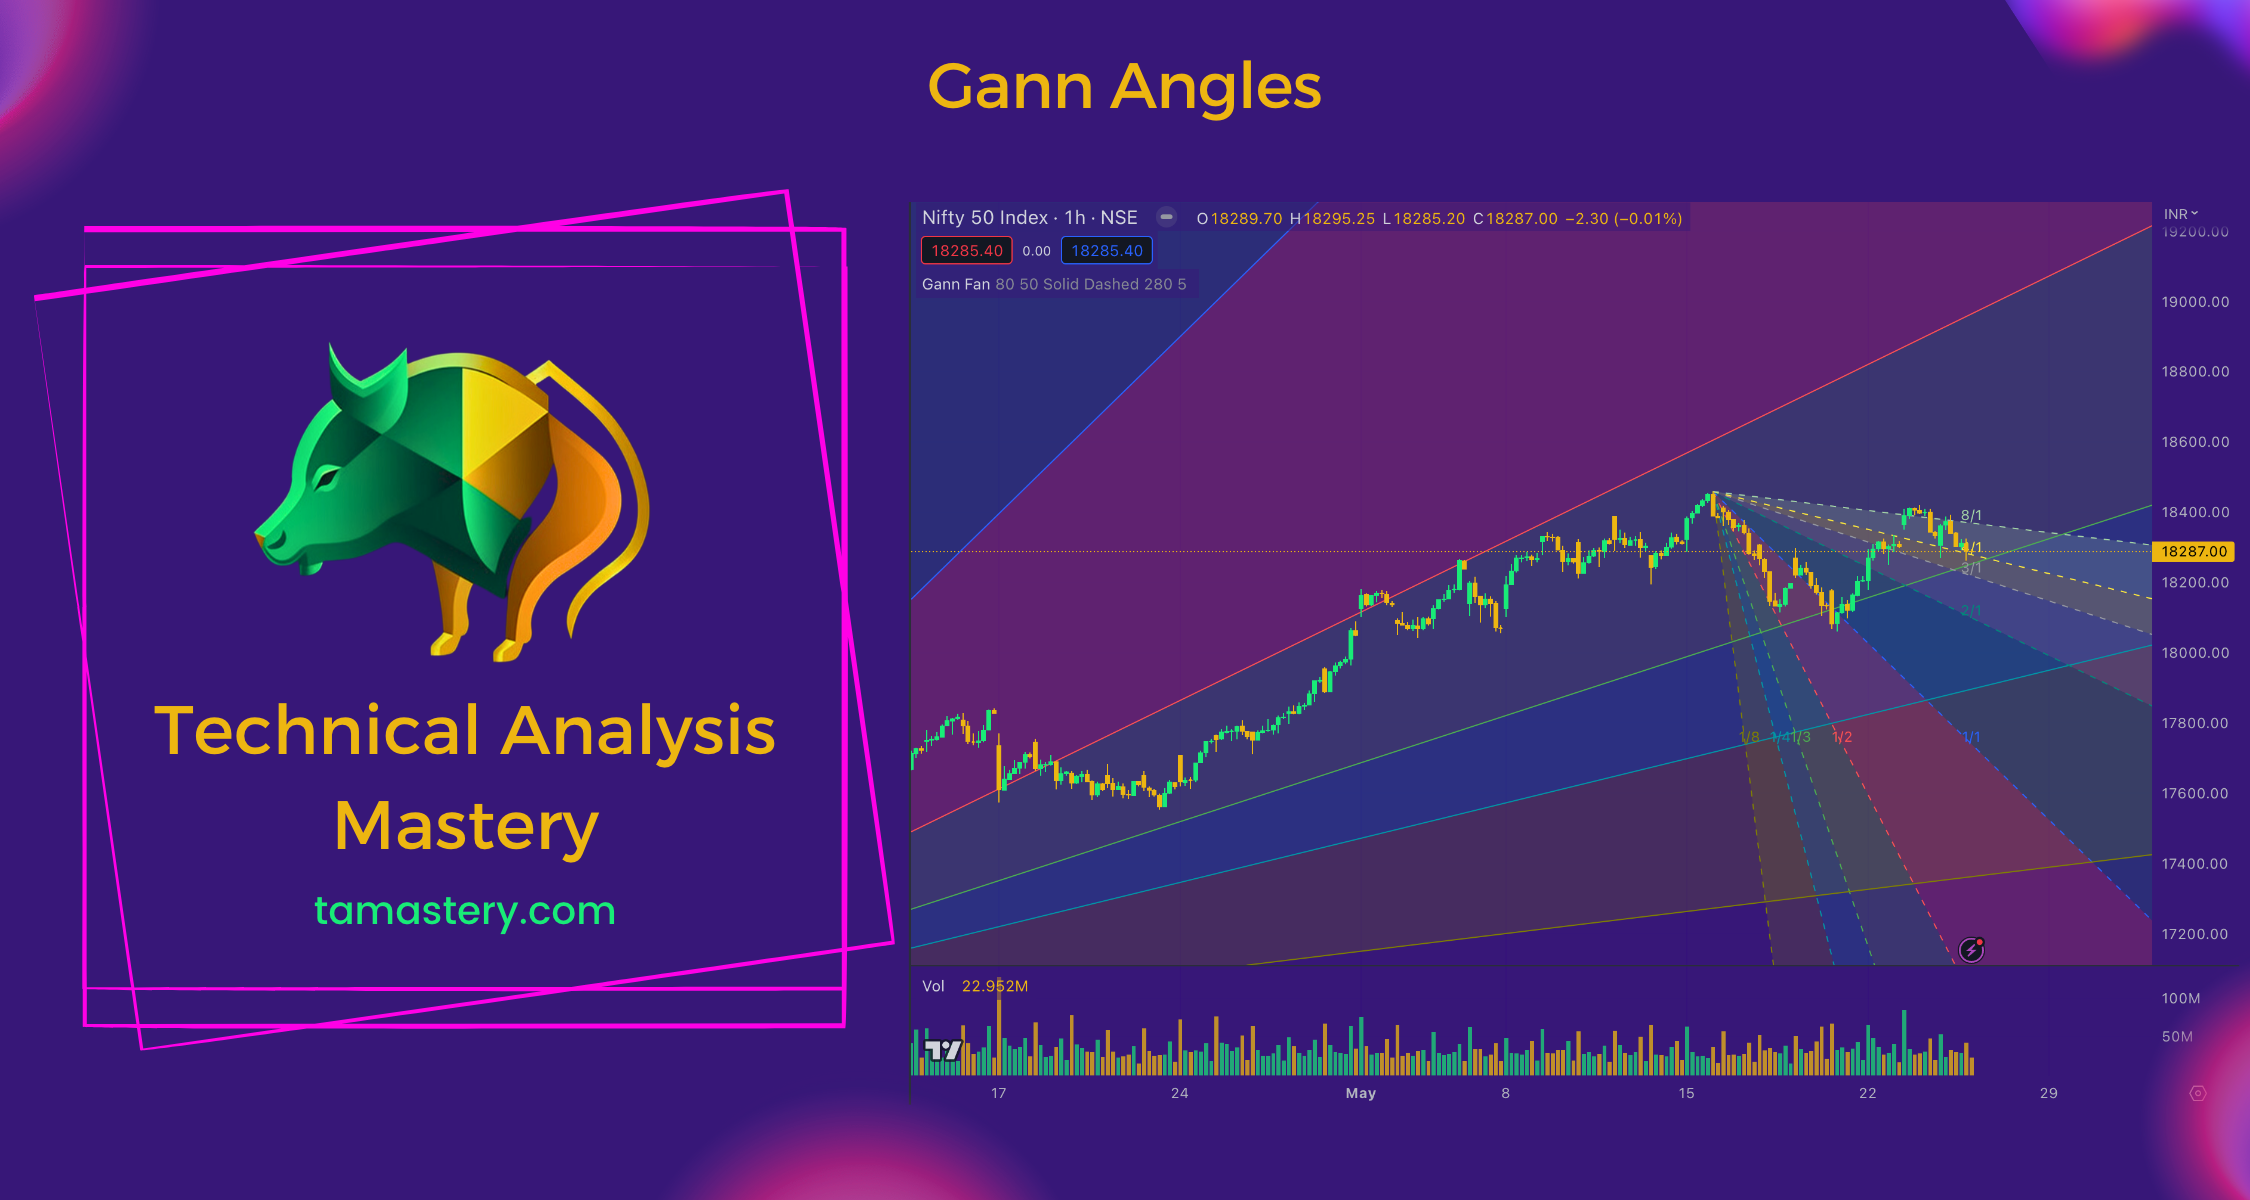
Gann Angles Gann Angles: The Compass of Stock Trading Discover Gann Angles and Gann Fan, potent tools in stock trading by W.D. Gann. These guides aid in understanding price movements and refining your trading strategy.
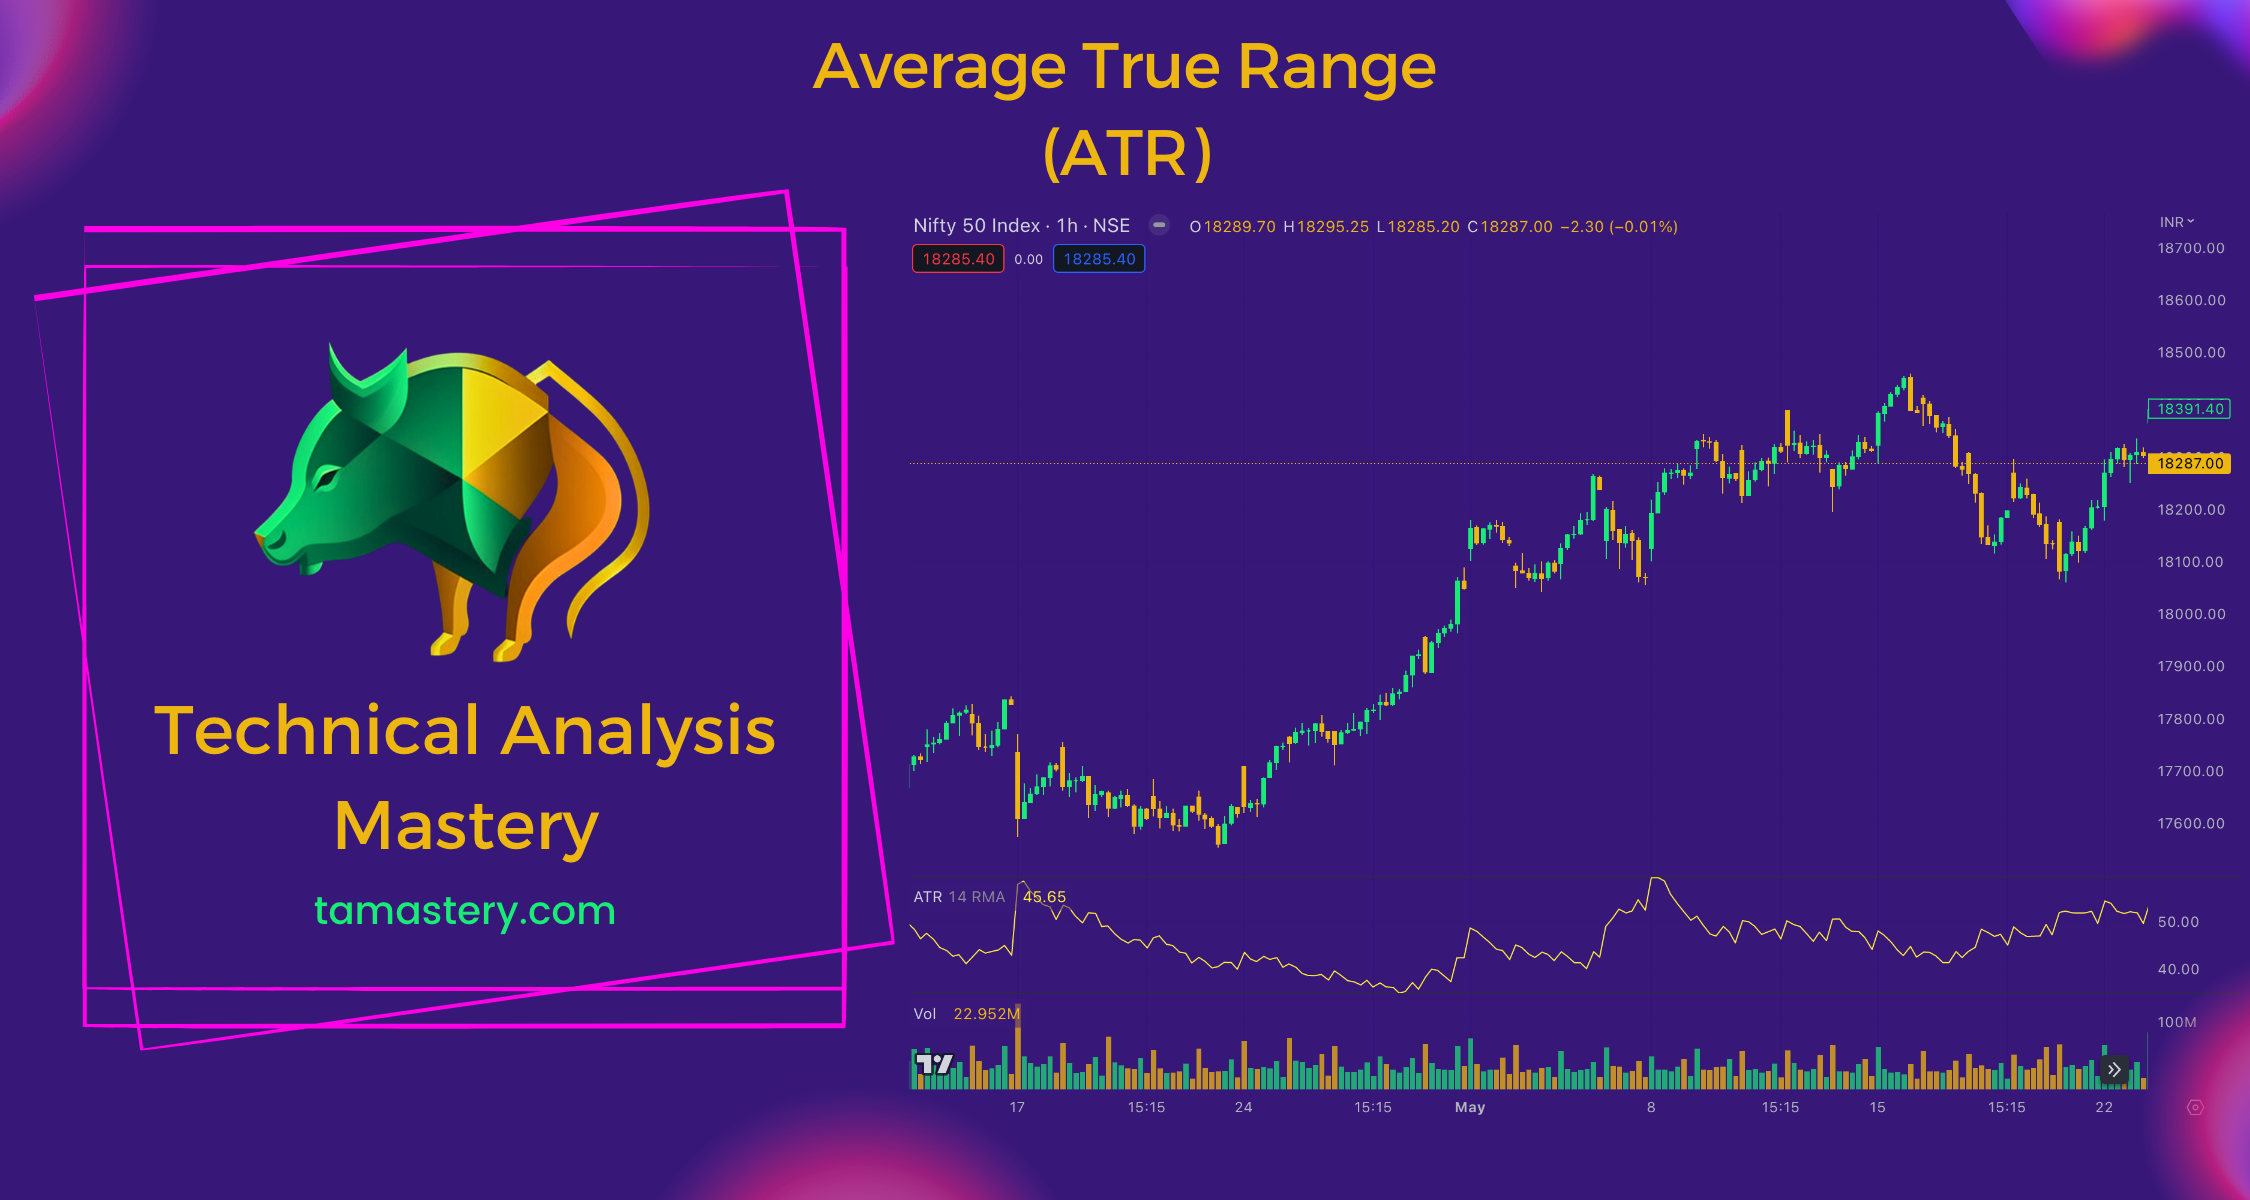
Average True Range Average True Range (ATR): The Weather Vane of Stock Trading Learn about the Average True Range (ATR), the weather vane of stock trading. ATR helps predict stock price movements, aiding in strategic decision-making. Understand its role in revealing potential trading opportunities.
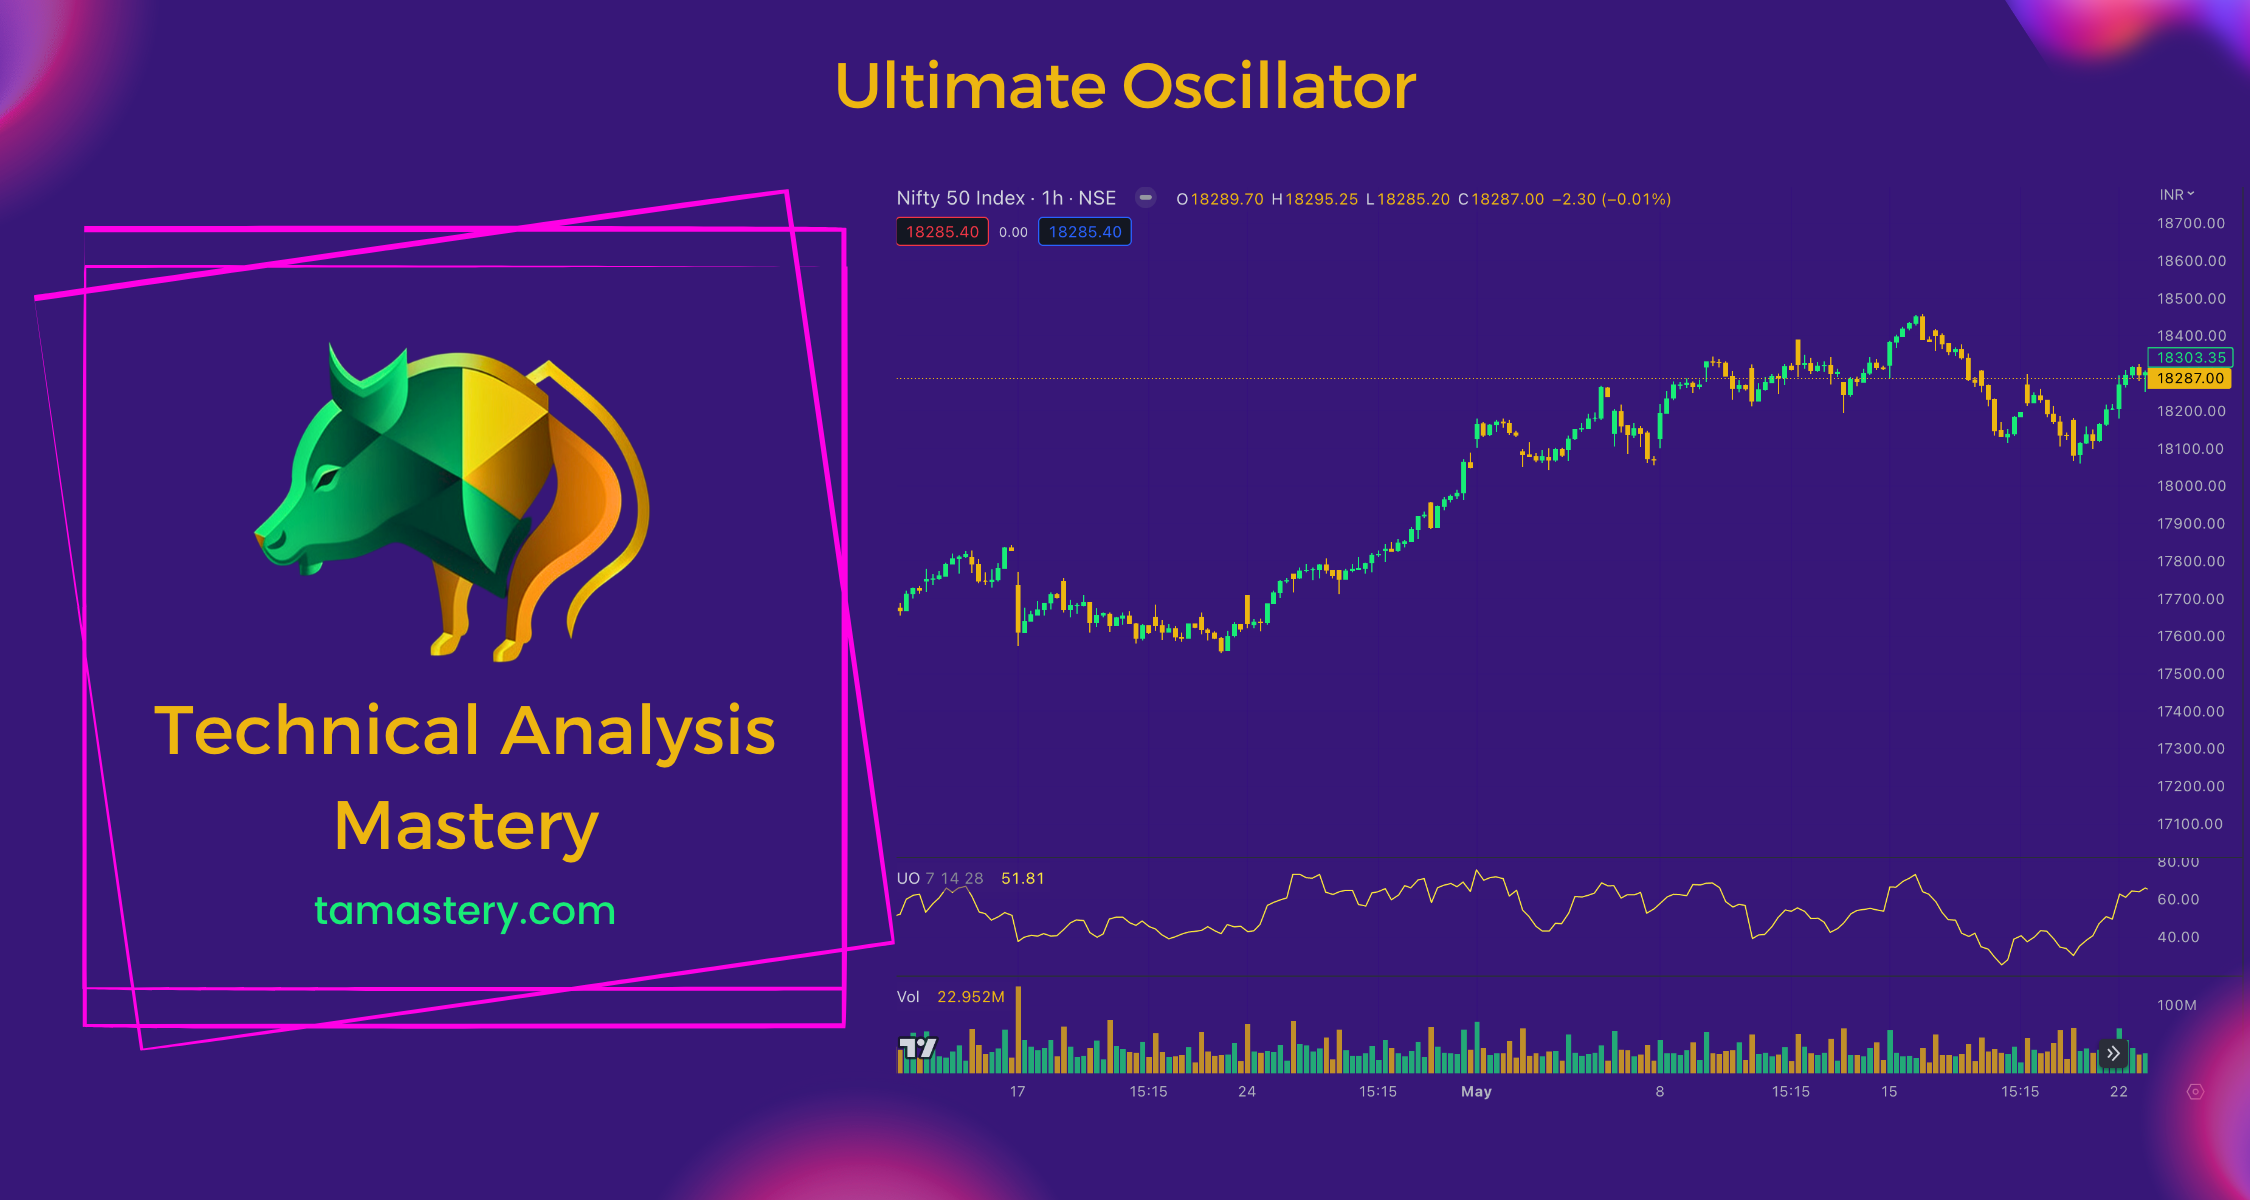
Ultimate Oscillator Featured Mastering the Stock Market Rhythm with the Ultimate Oscillator Experience the rhythm of the stock market through the lens of the Ultimate Oscillator. This powerful trading tool provides insights into buying and selling pressures over various periods, assisting traders to align with market tempo and make informed decisions.
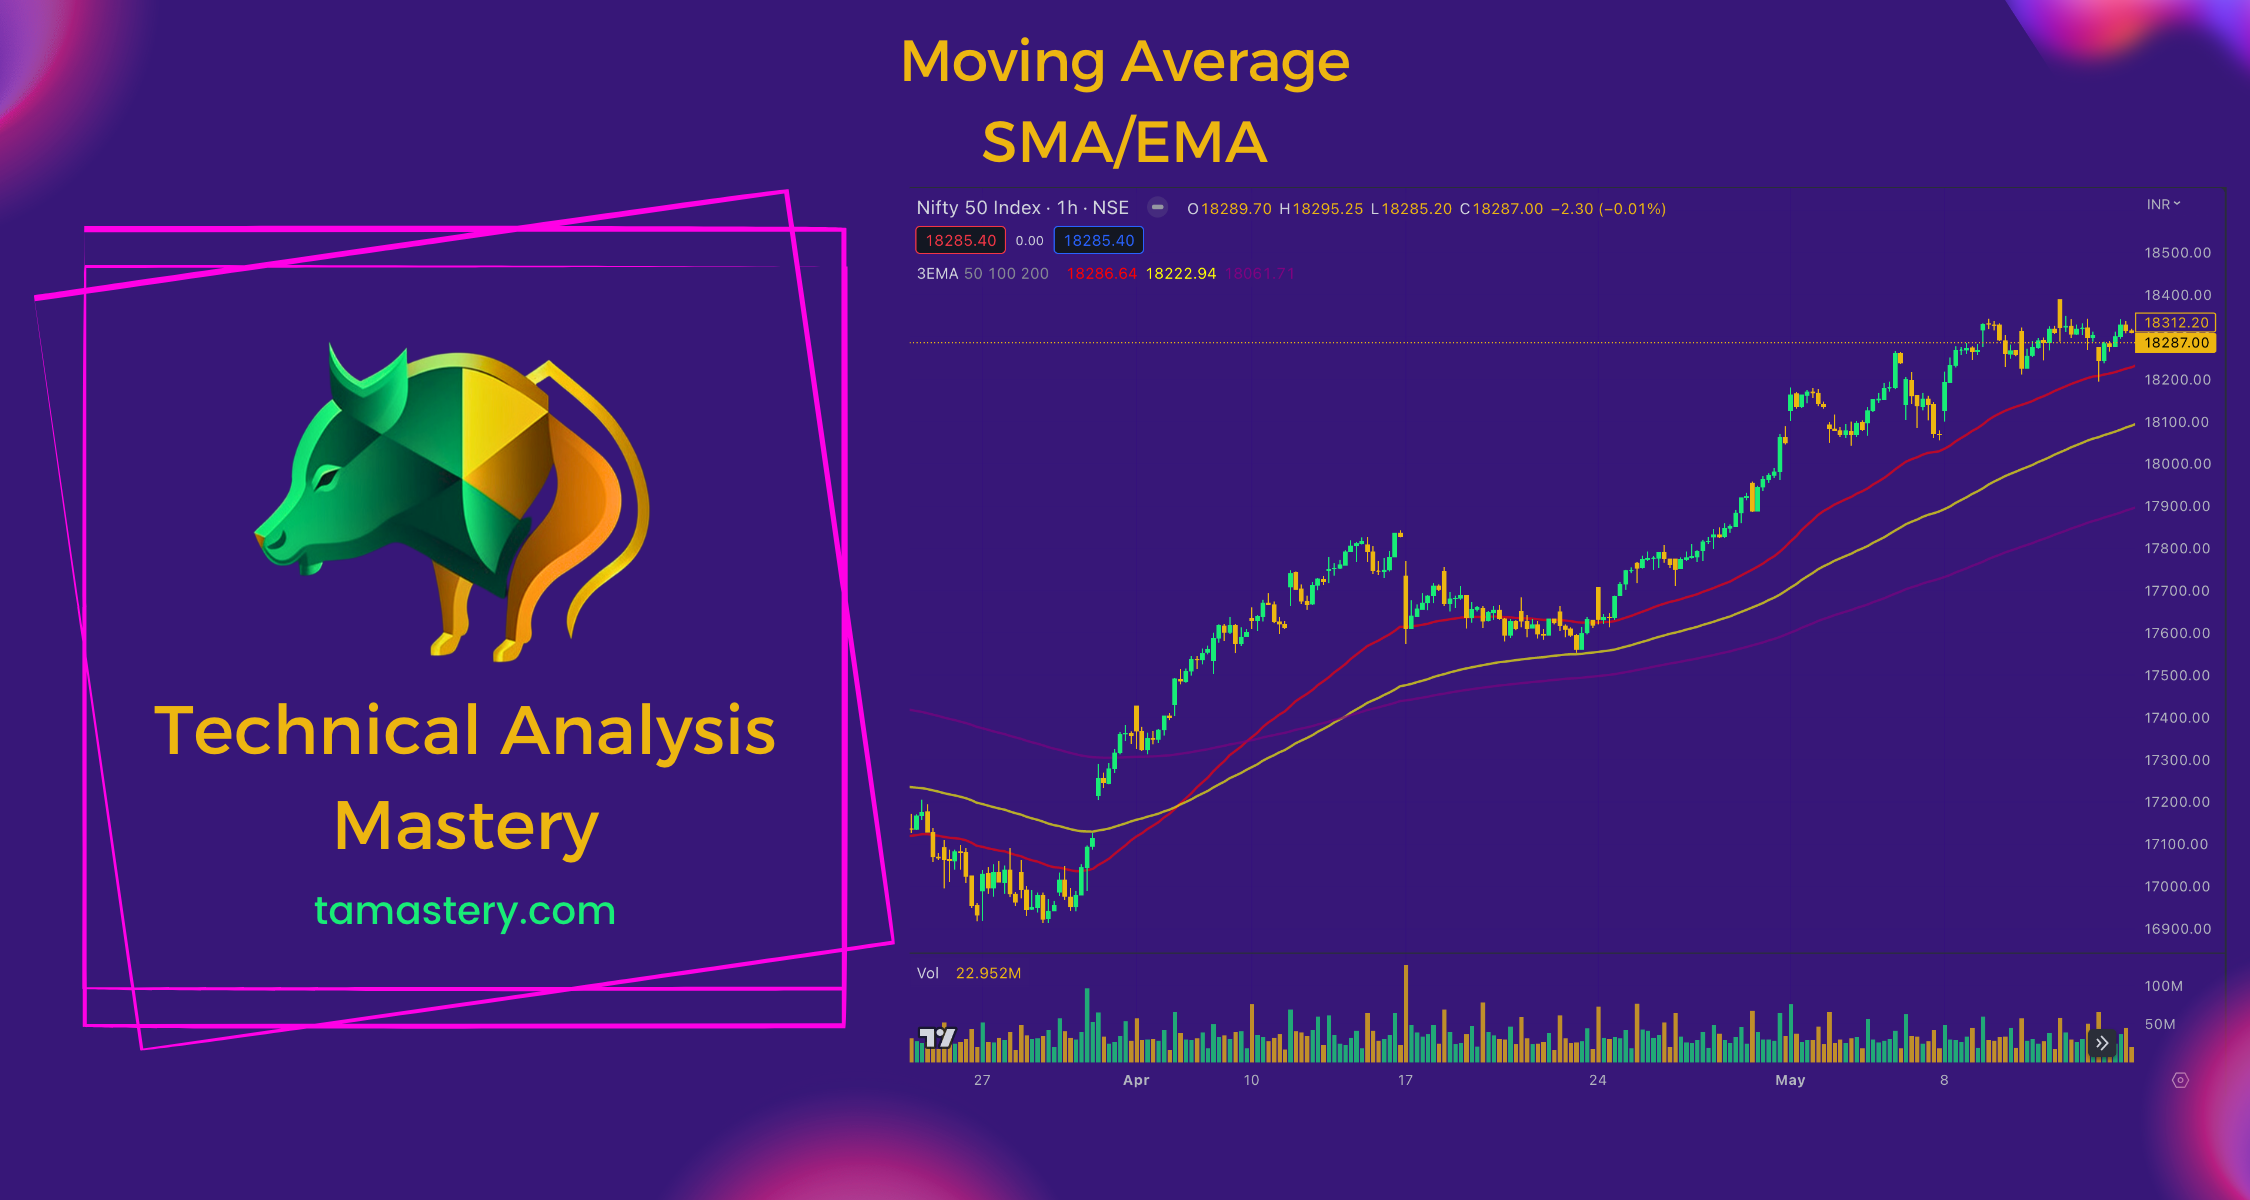
Moving Averages Understanding the Moving Average: A Key Tool in Stock Trading Explore the world of Moving Averages in stock trading and understand how they can help you analyze trends. Learn about Simple Moving Average (SMA) and Exponential Moving Average (EMA), and discover effective ways to incorporate them into your trading strategy.
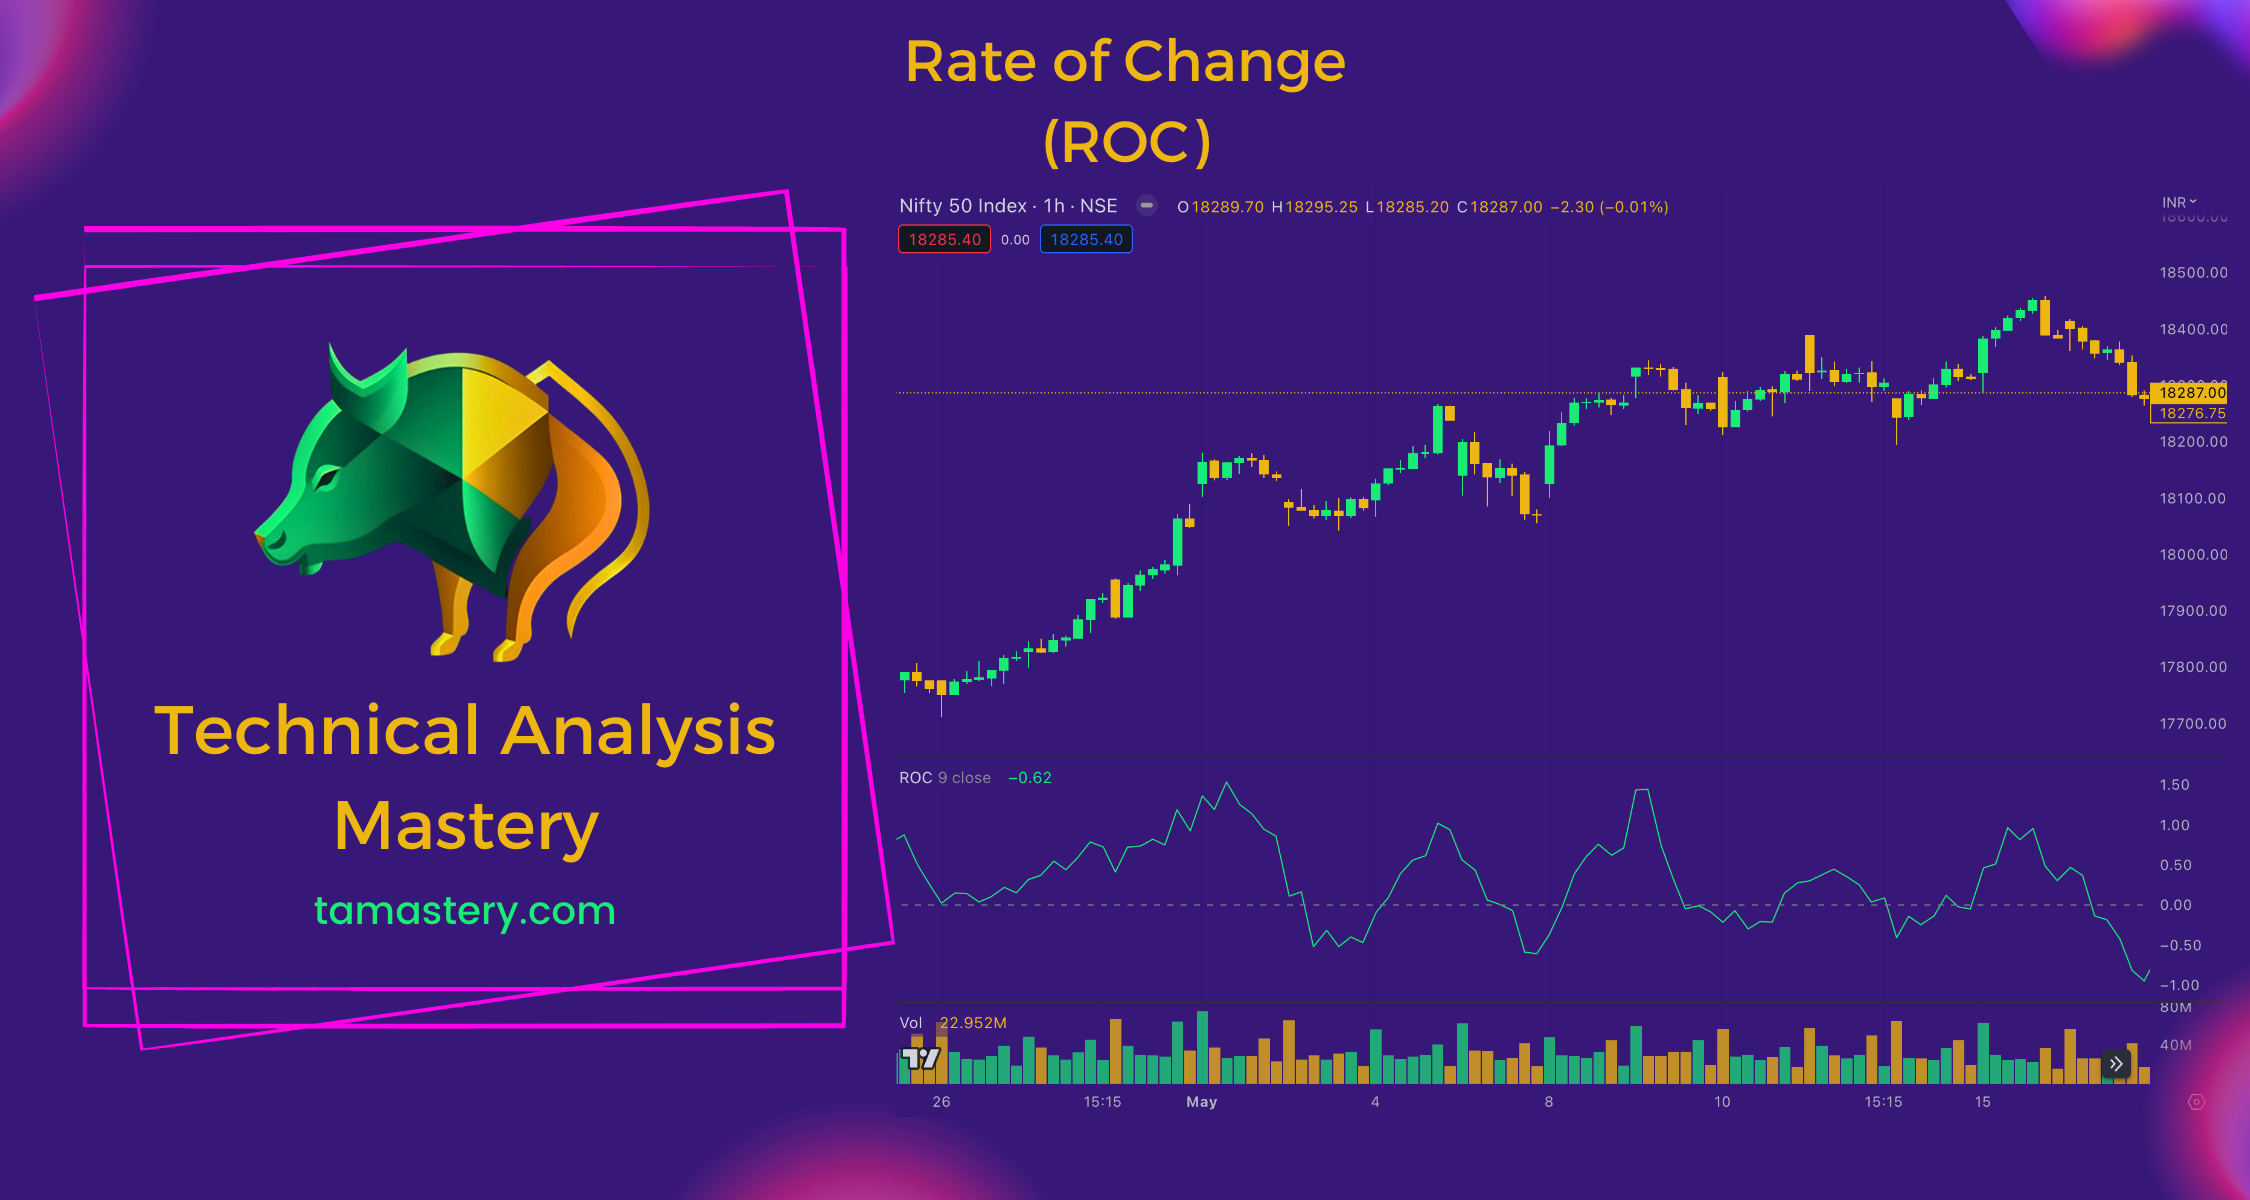
Rate of Change Featured Rate of Change (ROC): The Speedometer of Stock Trading Uncover the ROC's role in stock trading, working as a speedometer for price changes. Whether a stock's price is accelerating or decelerating, ROC offers valuable insights for informed trading decisions.
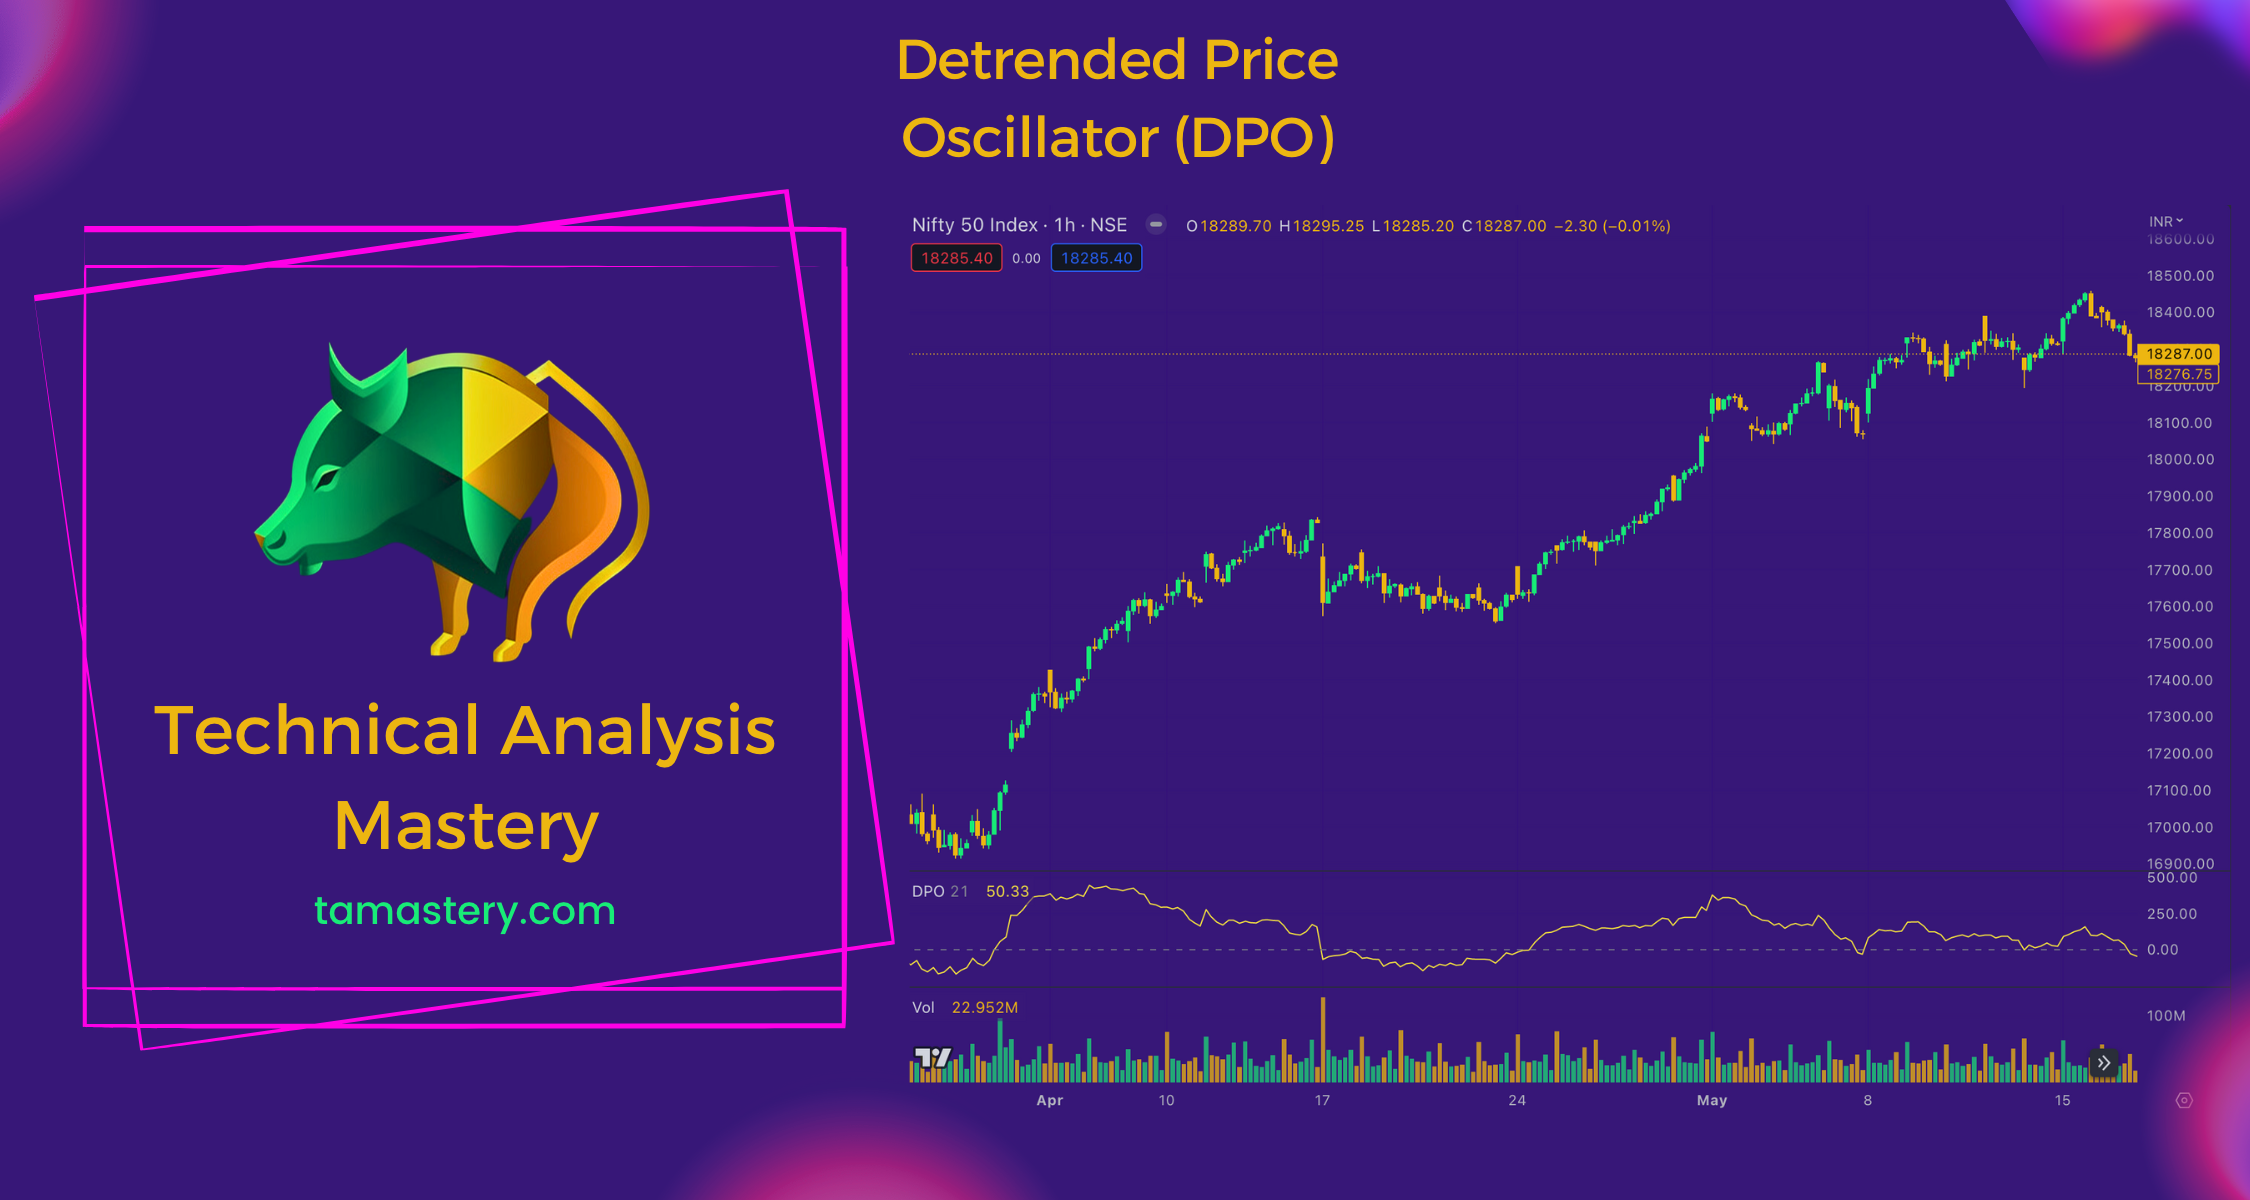
Detrended Price Oscillator Detrended Price Oscillator (DPO): The Time Machine of Stock Trading Explore the Detrended Price Oscillator (DPO) in stock trading. This 'time machine' highlights recent price fluctuations apart from long-term trends, enabling precise short-term market analysis.
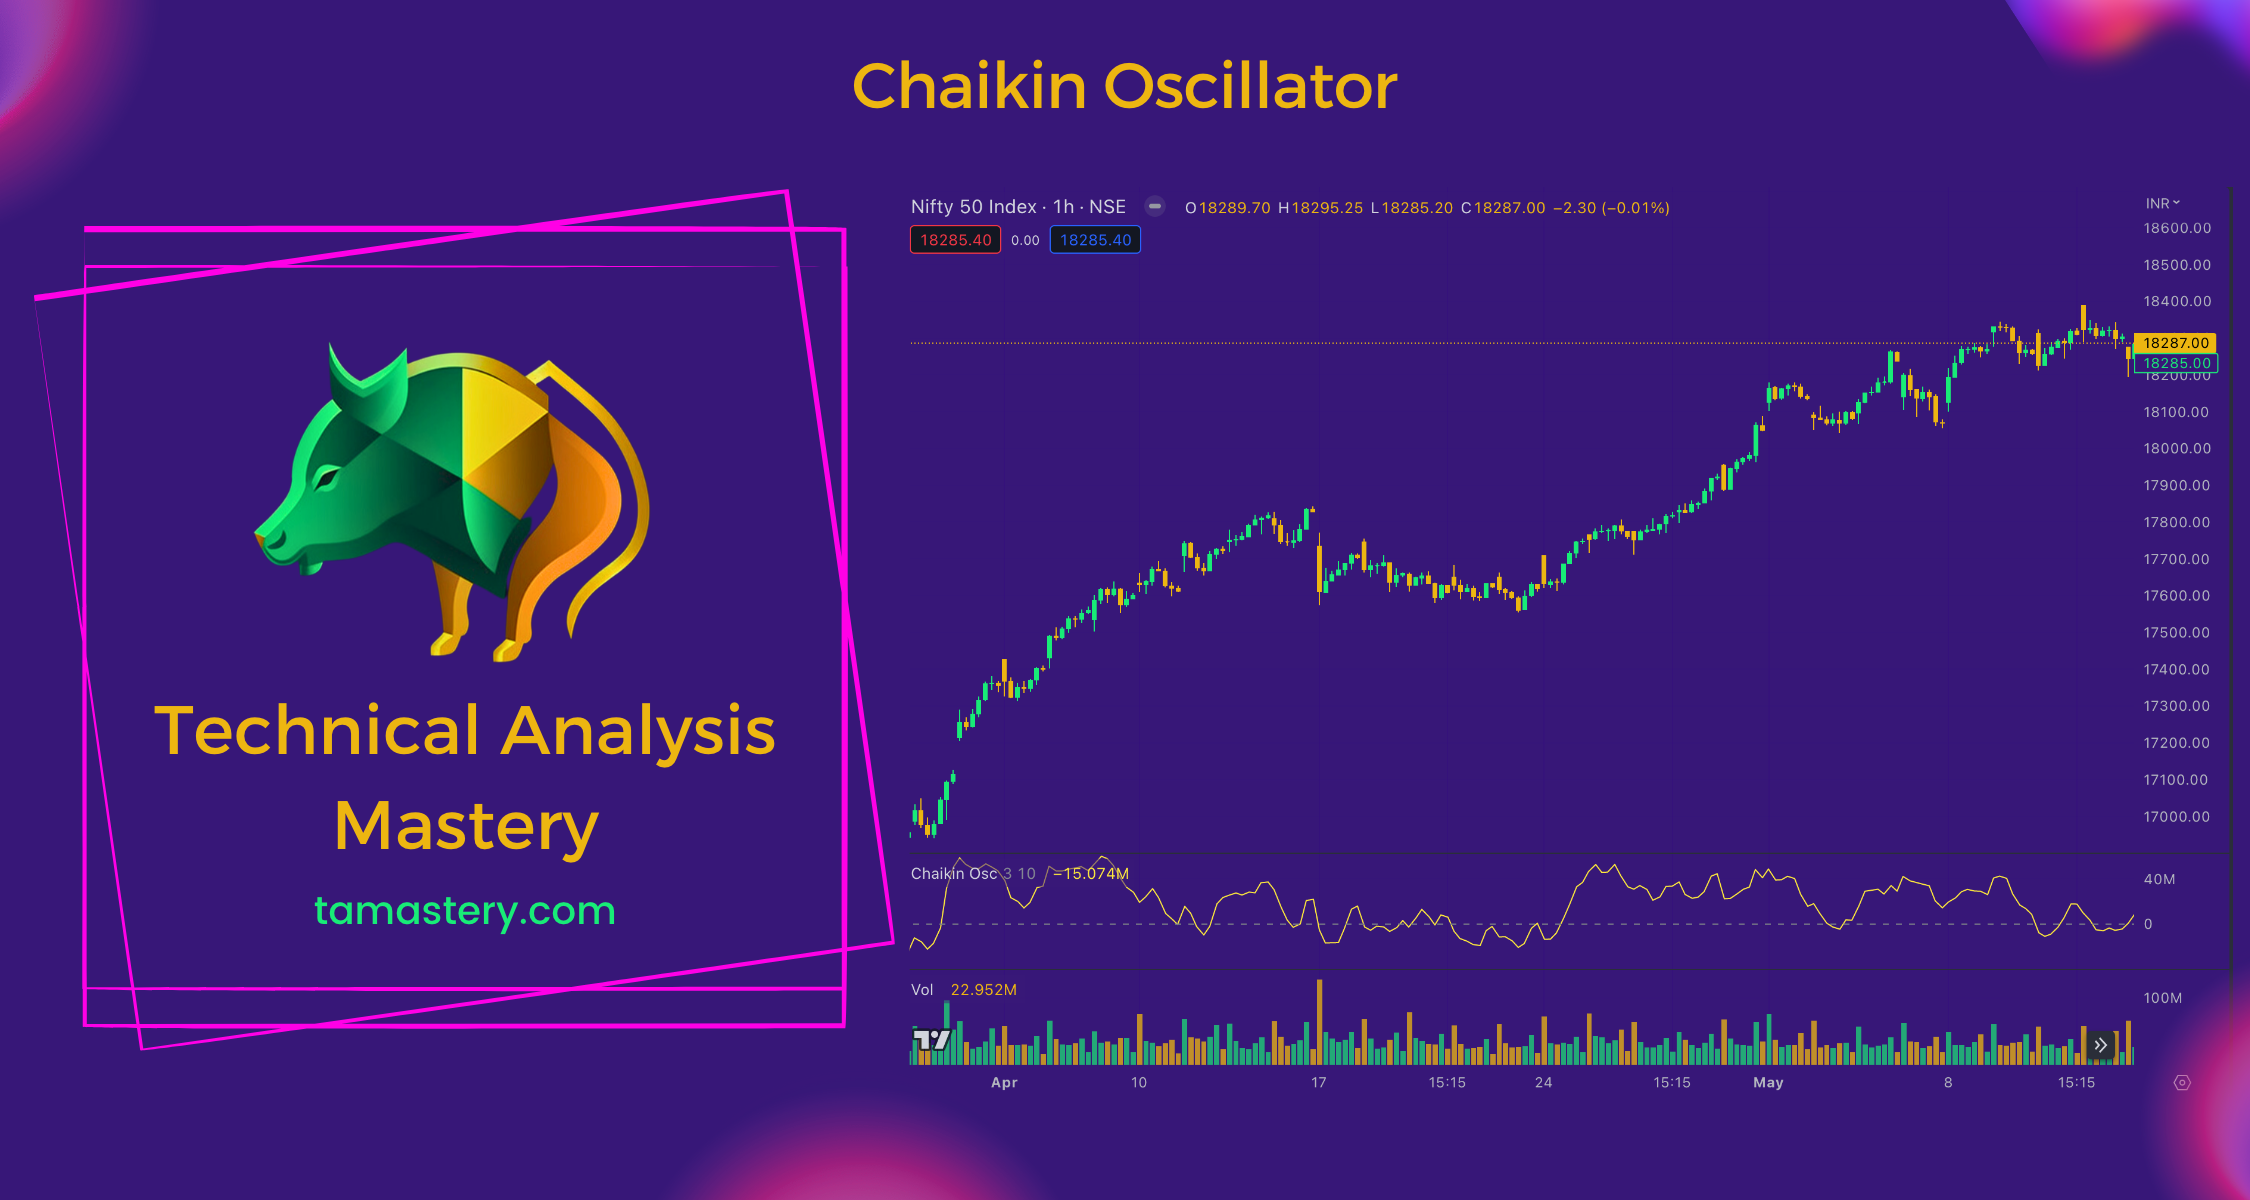
Chaikin Oscillator Featured Chaikin Oscillator: The Seesaw of Stock Trading Navigate the stock market playground with the Chaikin Oscillator - a tool that acts like a seesaw, illustrating the flow of money in and out of stocks. Understanding this can help anticipate potential price changes, guiding traders to make informed decisions.
Trix Indicator Understanding the Trix Indicator: A Comprehensive Guide This article provides a comprehensive overview of the Trix Indicator, including its definition, purpose, how it works, how it can be used to make investment decisions, and key considerations for investors.
Technical Analysis Indicators Understanding Technical Analysis Indicators in Stock Trading Technical analysis indicators are mathematical calculations that analyze market trends and help traders and investors make informed investment decisions. This article provides an overview of technical analysis indicators' types, purpose, and importance and how to interpret them.