Technical Analysis Mastery
  • Home
  • हिन्दी
  • About
Keltner Channels
Keltner Channels

Keltner Channels: The Race Track of Stock Trading

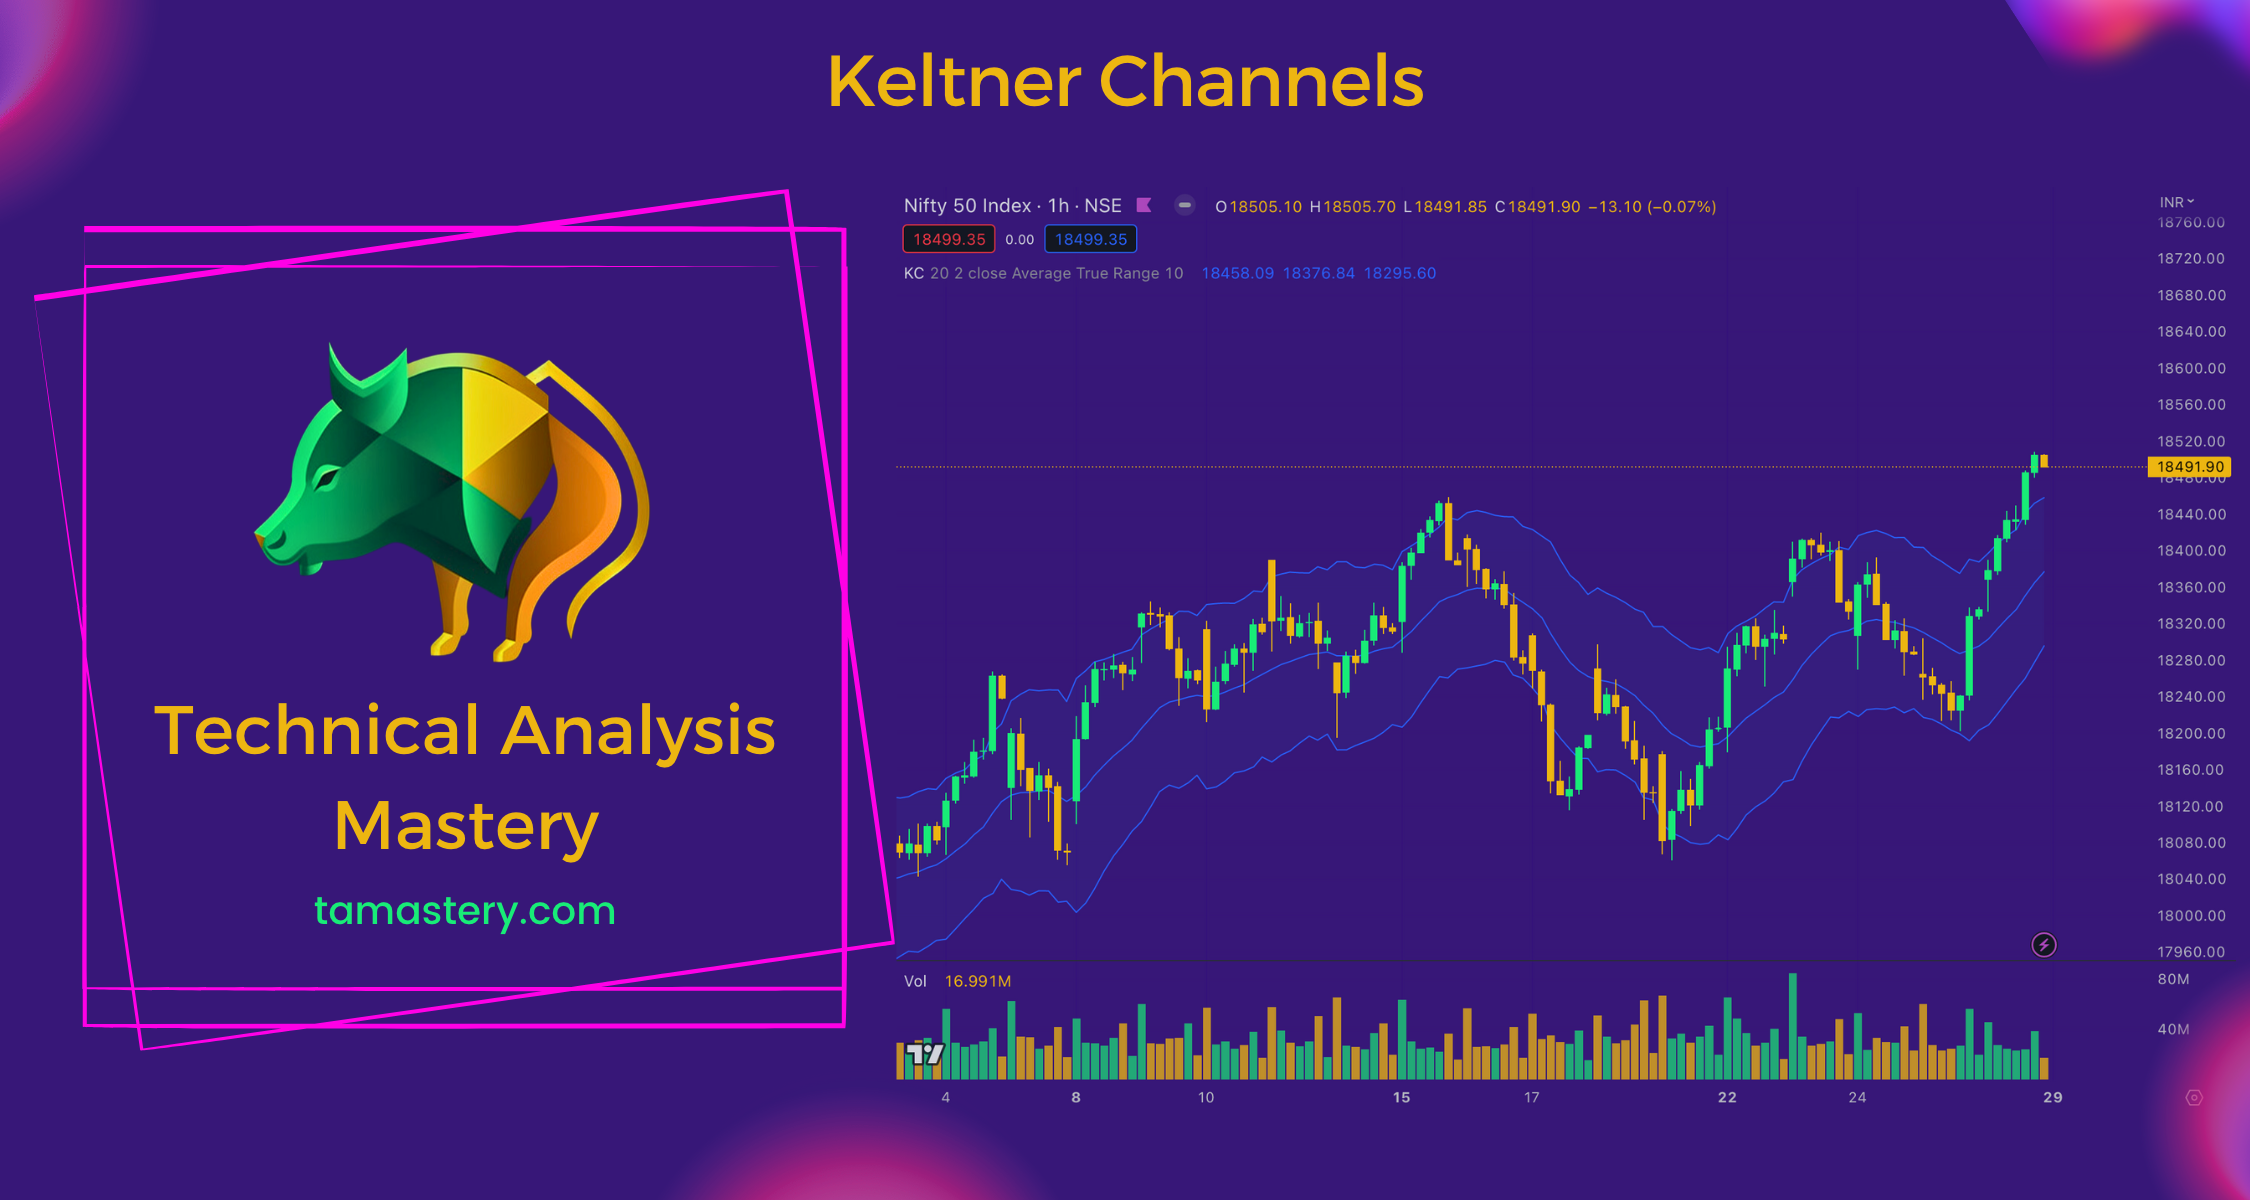
Explore Keltner Channels, the race track of stock trading. This tool charts the typical path of a stock's price, helping traders predict potential shifts. Just like racetrack guardrails, Keltner Channels signal when it may be time to buy or sell. Enhance your trading strategy with this dynamic tool.
May 31, 2023
Gann Angles
Gann Angles

Gann Angles: The Compass of Stock Trading

Discover Gann Angles and Gann Fan, potent tools in stock trading by W.D. Gann. These guides aid in understanding price movements and refining your trading strategy.
May 24, 2023
Ultimate Oscillator
Ultimate Oscillator Featured

Mastering the Stock Market Rhythm with the Ultimate Oscillator

Experience the rhythm of the stock market through the lens of the Ultimate Oscillator. This powerful trading tool provides insights into buying and selling pressures over various periods, assisting traders to align with market tempo and make informed decisions.
May 22, 2023
Moving Average
Moving Averages

Understanding the Moving Average: A Key Tool in Stock Trading

Explore the world of Moving Averages in stock trading and understand how they can help you analyze trends. Learn about Simple Moving Average (SMA) and Exponential Moving Average (EMA), and discover effective ways to incorporate them into your trading strategy.
May 18, 2023
Rate of Change (ROC)
Rate of Change Featured

Rate of Change (ROC): The Speedometer of Stock Trading

Uncover the ROC's role in stock trading, working as a speedometer for price changes. Whether a stock's price is accelerating or decelerating, ROC offers valuable insights for informed trading decisions.
May 16, 2023
Detrended Price Oscillator (DPO)
Detrended Price Oscillator

Detrended Price Oscillator (DPO): The Time Machine of Stock Trading

Explore the Detrended Price Oscillator (DPO) in stock trading. This 'time machine' highlights recent price fluctuations apart from long-term trends, enabling precise short-term market analysis.
May 16, 2023
Standard Deviation
Standard Deviation

Standard Deviation: The Bounce-o-meter of Stock Trading

Discover Standard Deviation in stock trading, the 'bounce-o-meter' gauging price jumps. This tool aids traders to predict volatility and make informed decisions.
May 15, 2023
Chaikin Oscillator
Chaikin Oscillator Featured

Chaikin Oscillator: The Seesaw of Stock Trading

Navigate the stock market playground with the Chaikin Oscillator - a tool that acts like a seesaw, illustrating the flow of money in and out of stocks. Understanding this can help anticipate potential price changes, guiding traders to make informed decisions.
May 12, 2023
Understanding Technical Analysis Indicators in Stock Trading
Technical Analysis Indicators

Understanding Technical Analysis Indicators in Stock Trading

Technical analysis indicators are mathematical calculations that analyze market trends and help traders and investors make informed investment decisions. This article provides an overview of technical analysis indicators' types, purpose, and importance and how to interpret them.
Feb 9, 2023
Technical Analysis Mastery © २०२६
  • Terms and Conditions
  • Privacy Policy
  • [email protected]
  • कुकी प्राथमिकताएँ
थीम Casper पर आधारित — © 2013–2026 Ghost Foundation (MIT)

We use cookies to improve your experience and analyse site traffic. See our Privacy Policy for details.